Daily Recap (WIP) — Data Storytelling
Strengthening owners’ understanding of their business with stories, not tables.
Info
Status

That’s a wrap
We’re recapping today, Friday Aug 14 — all 3 locations are closed and counted.
Overview
Today finished +15% vs a typical Friday
Airport Kiosk beat its usual by 20%, while Williamsburg slipped 10%.
Net sales by location · Friday
Airport Kiosk vs the dashed usual
Dashed: usual Friday
Moments of the day
Butterscotch Lattes went on a run
11 AM–12 PM was the rush — your biggest hour
“Kevin remembered my order before I said a word. The Cold Brew was perfect.”
Wins
Park Slope finished +16%
$0
vs $1,608 expected
Williamsburg finished +10%
$0
vs $1,361 expected
Airport Kiosk finished +20%
$0
vs $645 expected
Headwinds
Lattes ran behind usual
−$0
impact on the day
Blueberry Muffins ran behind usual
−$0
impact on the day
That’s Friday, wrapped.
Net sales
$0
15% higher than usual
Margin
0%
right on usual
Transactions
0
3% higher than usual
Profit
$0
24% higher than usual
Net profit %
0%
3.1 pts higher than usual
01 — Problem
Square sellers rely on mobile, but mobile reporting has lagged behind Square’s AI advancements
Business owners understand their business via broad data points, nothing like how it’s experienced on the ground. Here are some questions left unanswered by the current Daily Sales Summary:
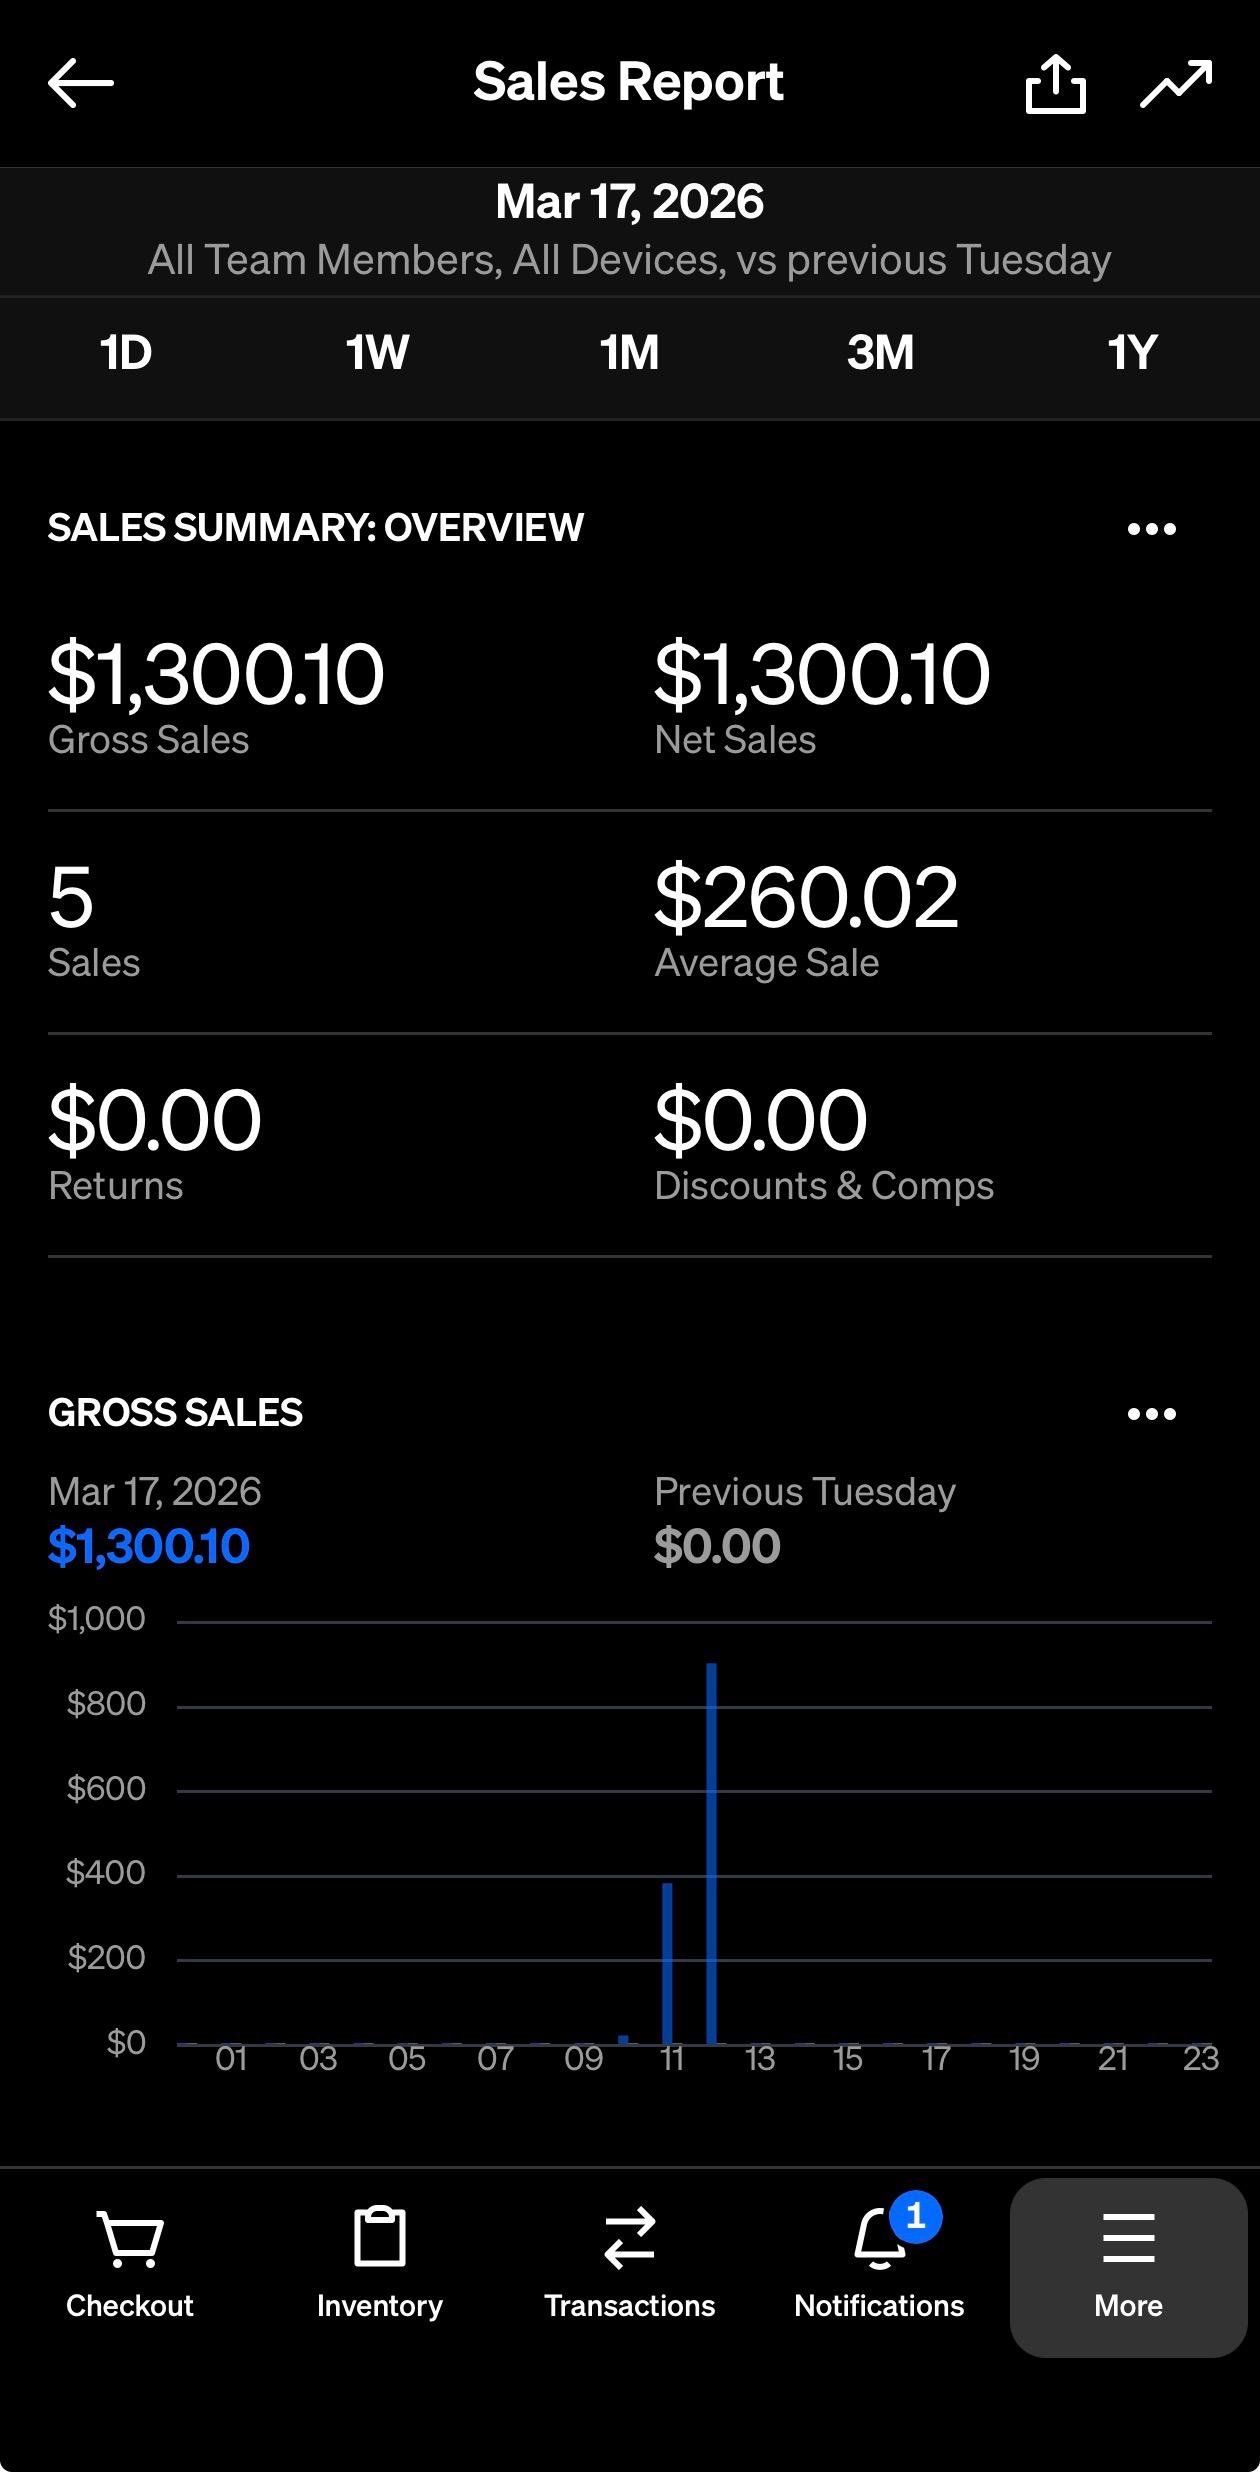
What’s an actual verdict of the day with all factors considered?
What deeper insights are hidden behind these “key” metrics?
What was the day actually like “on the ground”?
02 — Design Artifacts
WIP Components
Built to explore visually impactful & readable business data representation. These explorations form the basis of future iteration on data storytelling in this experience.